The Chinese Emperor's New Economic Clothes
All economic data contain errors, but China’s are a work of art. Like its numbers on COVID-19 infections and deaths, its official economic statistics are political artifacts, carefully devised to cloak the failings and trumpet the superiority of China’s one-party  political capitalist system over our liberal-democratic version. Probably most people around the world have been persuaded by the story of China’s astonishing economic progress, regret as we may its repressive dictatorship.
And yet there is plenty of evidence that China’s economy is much smaller and has grown more slowly than the claims of its official data. Its long-term growth performance is inferior to those of present-day Asian liberal-democracies like Japan, Taiwan, and Korea. It may not even be “the largest economy in the world.” And it will be harder hit by the COVID-19 pandemic in 2020 than its official statistics will ever admit.
I was reminded of these facts when looking through the International Monetary Fund’s new World Economic Outlook (WEO), widely considered the gold standard for global economic analysis and forecasting. The Fund carefully details how uncertain the pandemic renders its economic forecast for the world. But it says not a word about how its analysis is distorted by the use of China’s inflated official data and by overblown assumptions for Chinese growth. It is like the tale of the Emperor’s New Clothes, a polite fiction among the silk-stockinged managers of the world economy, a courtly convention not to mention the nakedness of the Chinese Emperor. Anyone who wants to do business with China must play along and help retail the political fictions of the party-state.
Here’s a sampling of recent evidence on China’s economy.
“A Forensic Examination of China’s National Accounts,” by Professor Chang-Tai Hsieh of Chicago University and others finds that the overstatement of China’s economic growth in its official data became marked after 2008, the year of the global financial crisis. That’s probably not a coincidence because China likes to flaunt strong economic growth during and after the financial crisis as evidence for the superiority of its one-party model. (Here’s a good summary in the Financial Times.) Using more reliable data on value-added tax revenues, Chang-Tai Hsieh et al. find that China’s real growth was overstated by two percentage points a year on average between 2010 and 2016. That would mean that China’s GDP in 2016 was 13 percent smaller than the official numbers. If the same gap persisted after 2016, China’s GDP last year, 2019, would have been 18 percent lower than official data. The difference between official growth and reality has probably exceeded two percentage points recently, as we’ll see.
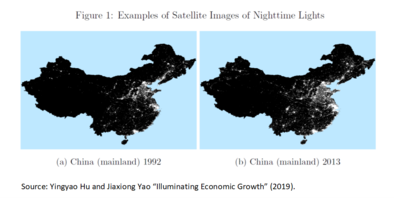
“Illuminating Economic Growth,” by Professor Yingyao Hu and Jiaxiong Yao of Johns Hopkins University takes a different – illuminating! – approach. It finds a reasonably tight relationship in most countries between official GDP and economic activity, as measured by satellite-recorded nighttime lights. But not in China, which shows significant, systematic errors between the two. Growth in official real GDP exceeded the nightlights based measure by 1.9 percentage points on average between 1992 and 2008, by 3.4 percentage points in 2009-2013 (the period of the financial crisis and its aftermath), and by 1.5 percentage points in 2014-17. Even looking only at discrepancies since the start of the financial crisis in 2008, the nightlights-based measure of GDP for 2017 was 21 percent lower than the official data (and 23 percent lower in 2019 if we extend the discrepancies out a couple of years.)
According to the IMF’s latest WEO database, China’s GDP (in purchasing power parity terms) was already 27 percent bigger than the United States in 2019. However, given the exaggeration in official data found by the two studies, China’s GDP today is likely about the same as the United States’. And since China’s population is over four times bigger than the U.S., its per capita income is still less than one quarter the U.S. level.
Greg Ip in the Wall Street Journal uses data from the Penn World Table to show that per capita income has grown less rapidly in China than in countries like Japan, Taiwan,  and Korea in their equivalent periods of fast growth. (Figure.)
In a comment on the findings of the nightlights study, Professors Yingyao Hu and Bob Barbera say that it would be naive to attribute all of the discrepancies to deliberate falsification of data:
“We offer the following hypothesis. China, in the aftermath of the Great Recession, committed substantial sums for office, apartment and infrastructure construction. Rapidly rising vacancy rates, however, suggest these investments, over the period in question, delivered less and less economic value. In effect, buildings kept going up in increasing numbers, but fewer and fewer lights went on.”
Analysts like Michael Pettis of the Carnegie Endowment note that the Party leadership sets official GDP growth as a political target, which local governments strive to meet through new investment projects, or by faking the data. The surge in increasingly unproductive construction investment since the financial crisis in 2008 was financed by borrowing. Credit rose from around 140 percent of official GDP before the financial crisis to over 250 percent in 2017. Yingyao Hu and Barbera estimate that debt in 2017 was a much higher 380 percent of income measured using nightlights, which is a more realistic measure of borrowers’ capacity to repay. China’s credit bubble is without precedent among large economies.
Officially China grew by 6.1% last year, although, if the trends identified by Professors Chang-Tai Hsieh and Yingyao Hu have persisted, the real increase in activity was more like 4-4½ percent. The lower numbers are undoubtedly more consistent with assessments by foreign investors during 2019:
“Their conclusion: China’s economy isn’t tanking, but it is almost certainly weaker than advertised. Some economists who have dissected China’s GDP numbers say more accurate figures could be up to 3 percentage points lower, based on their analysis of corporate profits, tax revenue, rail freight, property sales and other measures of activity that they believe are harder for the government to fudge”
said a September 2019 article in the Wall Street Journal.
Ordinarily, party leaders would have released the growth target for 2020 at the beginning of March, but this year it has still not been released as of late April. A 6 percent target had been expected, which – miracles! – would have exactly fulfilled the party’s goal of doubling the economy between 2010 and 2020.
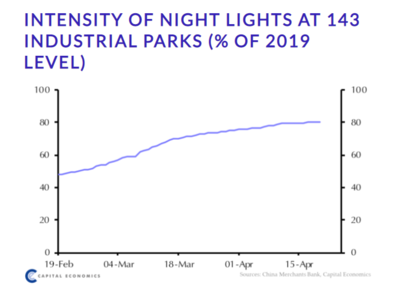 Now, however, the COVID-19 crisis has created a dilemma for China’s data fabricators. On the one hand, with millions thrown out of work, no one would believe a concocted 6 percent growth number for 2020. Capital Economics predicts a 5 percent recession for 2020, based on a study of indicators like nightlights, passenger traffic, and property sales. On the other hand, setting a target much less than 6 percent could risk a loss of authority for a supposedly all-wise, all-powerful communist party which failed to meet its long-term goal to double the size of the economy.
We can leave the Chinese party-state to its dilemma, puzzling over how to fix its economic data. In reality, the party-state came nowhere near to doubling the size of the Chinese economy between 2010 and 2020. Drawing on the estimates by Professors Chang-Tai Hsieh and Yingyao Hu, and Capital Economics’ forecast of a 5 percent contraction in 2020, China’s output probably only rose by 50 percent in the last decade, just half of the official target.
